Gomes, M. (2021). Unboxing Audacity: Mixing rhetorically with digital audio workstations. In K. D. Stedman, C. S. Danforth, & M. J. Faris (Eds.), Tuning in to soundwriting. enculturation/Intermezzo.
Gomes, Mathew. (2021). Unboxing Audacity: Mixing rhetorically with digital audio workstations. In Kyle D. Stedman, Courtney S. Danforth, & Michael J. Faris (Eds.), Tuning in to soundwriting. enculturation/Intermezzo.
Gomes, Mathew. 2021. "Unboxing Audacity: Mixing Rhetorically with Digital Audio Workstations." In Tuning in to Soundwriting, edited by Kyle D. Stedman, Courtney S. Danforth, and Michael J. Faris. enculturation/Intermezzo. .
Gomes, Mathew. "Unboxing Audacity: Mixing Rhetorically with Digital Audio Workstations." Tuning in to Soundwriting, edited by Kyle D. Stedman, Courtney S. Danforth, and Michael J. Faris, enculturation/Intermezzo, 2021, .
4. The Space and the Tools: Audio Mixing Techniques
Mixing involves some common nondiscursive techniques for organizing and arranging sonic material, which Audacity makes available in its graphical user interface (GUI). These techniques are common to the extent that we can hear them in popular examples of soundwriting, and because they are common, they are also widely available across multiple digital audio workstations (DAWs) even though I focus on Audacity. (However, I hope teachers using Audacity will find this a helpful guide for navigating the software.)
Soundwriters can practice mixing rhetorically by observing headroom, adjusting gains, panning sounds, analyzing frequency plots, and applying equalization curves. Each of these techniques may entail critical engagement with writing technologies while also raising ethical and rhetorical questions pertaining to choices soundwriters make about the arrangement of sonic information and the descriptive effects of this arrangement.
Technique 1. Monitoring Headroom
In audio engineering, headroom refers to "the difference between the maximum level that can be handled without incurring distortion and the average operating level" of an audio system (Huber & Runstein, 2010, p. 458). This margin is similar to the margin at the edge of college-ruled notebook paper, or the margins in commonly used word-processing programs. When the DAW detects no remaining headroom, "clipping" and audio distortion occur. Clipping refers to the distortion and loss of digital information that happens when levels exceed 0 decibels (Izhaki, 2012). Clipping can be problematic because it indicates that not all sonic information soundwriters are working with in a DAW will be audible in distinct ways to listeners, and it may signal uncomfortable levels of loudness.
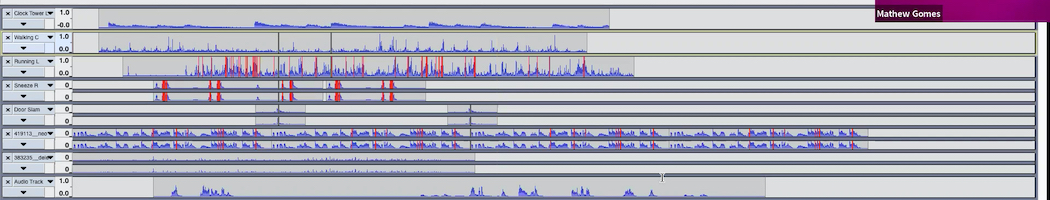
It is easy to run out of headroom and incur distortion quickly, without any type of mixing. For example, "The Sneeze Problem" contains tracks for many different sounds, including (1) a clock tower, (2) several sneezes, (3) the sound of somebody running with keys, (4) video game beep/boop noises, (5) video game controller noises, (6) the sound of the male speaker walking, (7) a door opening and shutting, and (8) the male speaker talking on a phone. When these tracks sound simultaneously, unmixed, Audacity indicates nearly the entire piece operates above the maximum levels in both the left and right speaker channels. There are simply a lot of sounds to manage.
Monitoring Headroom: Description/Transcript
[Video shows Mathew working in the Audacity software to demonstrate how to monitor headroom in it. As he interacts with Audacity, he says the following.]
Mathew: Alright, I'm here in Audacity, and I've opened up the unmixed version of "The Sneeze Problem." You can see that the sneeze problem has 1, 2, 3, 4, 5, 6, 7, 8 different tracks, and so one thing that we might be able to anticipate just right from the beginning is that there's going to be a lot of sound information and that we may have some clipping in this track. One way that we're going to be able to identify clipping in Audacity is if we look up here, you'll see what's called the Playback Meter Toolbar; it has a little speaker icon and a left and right [channel], and then it's got this scale that's running from left to right here. This is default in the GUI, but we can turn it on if we go to "View > Toolbars," and it's right here: "Playback Meter Toolbar." And so what I want to do is just observe this Playback Meter Toolbar as we play the track. So let's start it right here at the beginning. [plays track]
[pauses track] One thing you'll see—and we've got the peak meters up here as well—is that there's quite a bit of clipping on this track. Clipping is when you exceed in one channel or the other a maximum amplitude of zero decibels—or an anticipated rate of a maximum amplitude of zero decibels. And so we can see that almost from the very beginning of the track, there's clipping that's happening.
So pretty consistently, especially during this very busy portion of the track, there is a lot of clipping. That is what I'm calling "monitoring the available headroom." So to monitor headroom we'll just take a look at this Playback Meter Toolbar and see how it responds to the various sounds that we have in this track.
We can maybe see what types of things cause this to clip. Actually, Audacity starts to identify some of these things for us. If you take a look, I've collapsed all these tracks, but if I expand them, you'll see that there are these red lines on the tracks, and these are warning signs that there's content here that may be causing this overall volume to clip. And so that's one potential indicator, and let's see if it holds true. [plays track; video ends]
I began making decisions about how to mix "The Sneeze Problem" by monitoring the available headroom in the sound composition over time. Because I wanted to better convey a narrative with a modest degree of descriptive realism, I needed to observe when and where sound information was obscured or lost. Roey Izhaki (2012) noted that audio engineers may typically leave 3 decibels (dB) of headroom for a variety of reasons, including the variances in audio hardware used for playback (p. 53). For soundwriters, monitoring headroom means noticing the average amplitudes the DAW is outputting to the left and right speaker channels. Monitoring headroom is an important first move in mixing rhetorically that aims to help soundwriters consider the rhetorical or ethical affordances and risks of operating with too much or too little headroom.
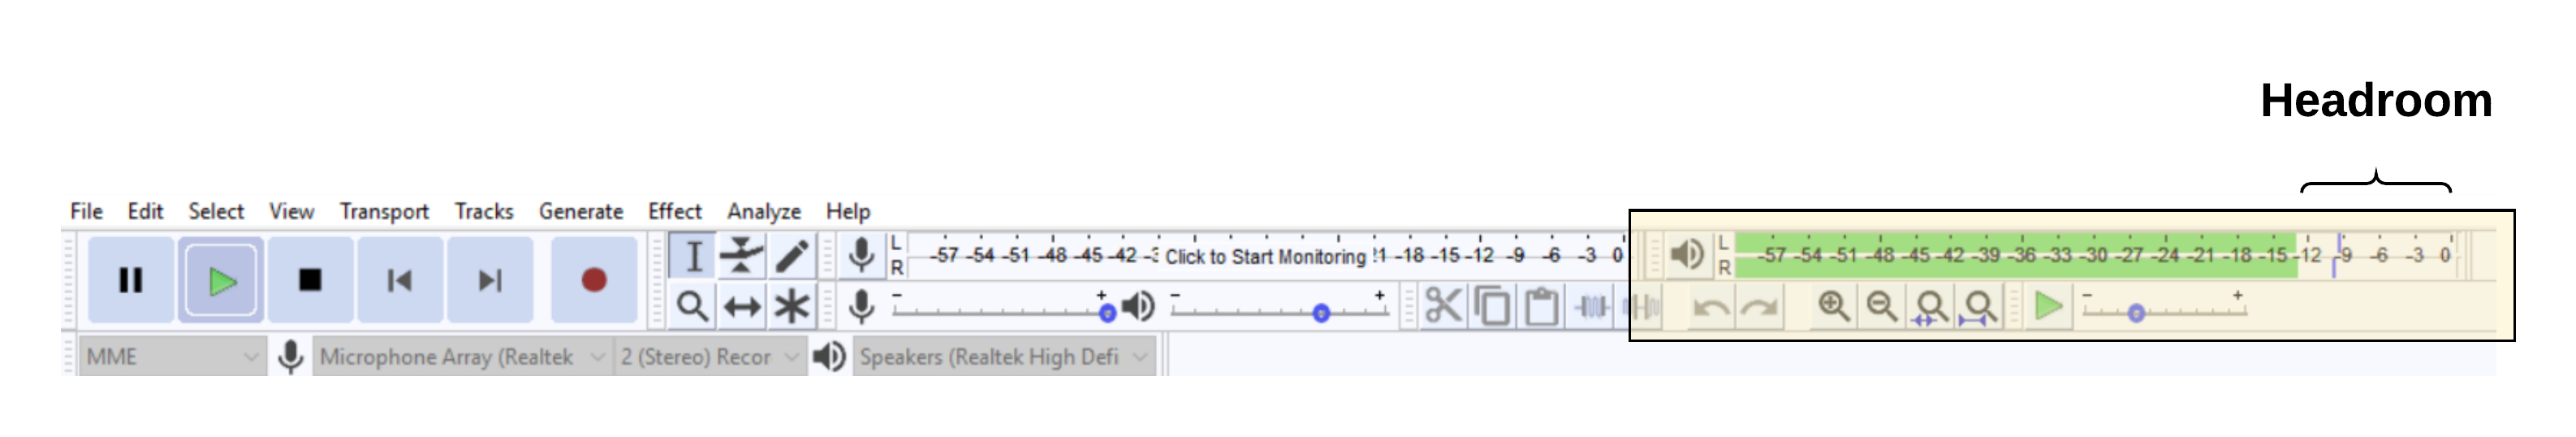
In Audacity, soundwriters can observe headroom by analyzing the Playback Meter Toolbar (PMT), which is visible by default within Audacity's GUI. While this feature should be present when soundwriters first open Audacity, the feature can also be toggled on or off in the "View" menu (View > Toolbars > Playback Meter Toolbar). As you saw in the video "Monitoring Headroom", the PMT is located at the top of the interface and demonstrates the momentary output of all sonic information to the left and right speaker channels. This information is represented by colored bars, which is gradient from green to red. Additionally, Audacity's PMT contains a marker that represents the immediate peak operating levels. The PMT also displays available headroom, represented as the negative space that remains between the 0 dB marker and the average operating level (see Figure 2).
Figure 2. Playback Meter Toolbar and remaining headroom.
Audacity's PMT also warns soundwriters as the headroom diminishes and amplitudes regularly approach levels of 0 dB. As the video "Monitoring Headroom" shows, when the volume increases, the color of the information in the PMT changes from green to yellow to red. As less headroom becomes available in the sonic mix during recording and playback, Audacity alerts users with yellow and red colors in the PMT.
Analyzing headroom can also help soundwriters locate where in stereophonic space there is too much sonic information. In "The Sneeze Problem," the PMT represents excessively loud peaks with three instances of the PMT displaying red. In each instance, both the left and right channels display red, meaning that the mix volume exceeds 0 dB in both channels. To resolve this problem and preserve headroom, users may infer that the amplitude of sounds coming from both the left and right channels needs to be reduced.
Headroom also comes with a set of ethical considerations for soundwriters: As the average operating levels approach 0 db, audio technologies will have reduced capacity to process sonic information and may incur material damage. Soundwriting that operates with consistently reduced headroom will have reduced fidelity in interactions with other audio hardware. In some cases, this may be a rhetorical affordance, which exposes the contingency and codependency of sonic production with material environments. Reduced headroom also comes with other ethical questions: listening audiences may have reduced capacity to differentiate sonic information and may be more likely to have hearing damaged by audio that operates at or near maximum audio levels.
Technique 2. Dynamics Processing
Applying dynamics processing will help students and teachers make additional headroom and intervene in moments of clipping. In audio engineering, dynamics processing involves altering amplitudes of the overall output or of individual sounds (Huber & Runstein, 2010, p. 33). As a second technique for mixing rhetorically, soundwriters can apply dynamics processing as an arrangement strategy to prioritize sound information and detail the relative proximity or loudness of sounds.
Dynamics processing can help writers prioritize sound information. Izhaki (2012) described how this principle works in music, writing, "the higher the level of an instrument in the mix, the more it will tend to mask other instruments, and the more clearly it will be perceived" (p. 14). This is because when sounds are combined, they compete for space and increase the likelihood of exceeding 0 dB in one or more frequencies. For soundwriters, decreasing the levels of sounds will make them less audible, while increasing their amplitude will make the sounds more audible. As a practical rubric, students might choose to organize sound compositions by reducing the amplitudes of less significant sonic information or by increasing the amplitudes of more significant sonic information.
Soundwriters can also apply dynamics processing to detail the relative proximity of sounds to the listener and to one another. This may create an impression of distance or closeness. Decreasing the gain can lend sounds an impression of distance, while increasing the gain can give the impression of closeness. In "The Sneeze Problem," I adjusted the levels of nearly all the tracks. The video "Modifying Amplitude" demonstrates how I used dynamics processing in Audacity to prioritize some sonic information as well as create an impression of proximity to the video game and sneeze tracks. Both these tracks contributed significantly to the overall playback amplitude, but they were somewhat ancillary to the larger narrative purpose of the soundscape. Thus, the video shows my modifications to the amplitude of both of these tracks. Additionally, I subsequently reduced the levels of the sneeze and increased the amplitude of the video game sounds to create the impression that listeners are moving further away from the sneeze and closer to the video game sounds. These changes complement the narrative of the male character moving through several loud environments to talk on the phone.
Modifying Amplitude: Description/Transcript
[Video shows Mathew working in the Audacity software to demonstrate how to modify amplitude in Audacity. As he interacts with Audacity, he says the following.]
Mathew: Knowing that those are very loud tracks, we can modify the amplitude of those in a few different ways. Let's try a couple different ways here.
If we want to just control the level of the entire track, reduce the level of the entire track, then that's something that we can do. We've got a gain slider right here on the left side of the track, and if we move this gain slider either up [left] or down [right], it will adjust the level for the entire track and reduce the overall amplitude of that track. We can see if we actually slide this all the way down—let's see what happens when we do that—we should barely be able to hear these video game sounds at all. [plays track with video game sounds inaudible]
Yeah. So we can't hear this. Let's bump this up just a little bit. Let's do the same minus seven. [plays track with video game sounds loud in the mix]
So we can hear it now—it's even pretty loud, so we might even take it down a little bit further. So that's one way to modify the amplitude of a track, and this happens at the track level.
There are other ways to modify the amplitude of sound, and we can just select a portion of a track. For example, let's say we just want this portion to be a little bit softer than it is. We can go up here to the effects, and we see that there's a tool called "Amplify" right here. This actually allows us to make it louder or softer. And let's—in this moment, I want to convey the sense that the listener is outside of these sounds, so for that reason, I think it's fine to drop this quite a bit from where it's at. See, that's a much smaller waveform and a much softer sound, we can probably anticipate. Let's see what that sounds like. [plays track with video game sounds audible but quiet]
So that was a pretty dramatic decrease in volume. I might actually undo that one and try it one more time. Let's go a little bit louder. One thing to know here is that any reduction in either the gain or the amplitude is a logarithmic function, so it's not linear. So it's going to get, actually, exponentially softer as we drop it each decibel. [plays track with video game sounds in between the two previous volume settings]
That's a much better volume for that track, I think.
In Audacity, soundwriters can adjust the overall amplitude of track levels by moving the gain slider left and right. Audacity sets the track to a level of 0 dB by default. Soundwriters can adjust the gain slider to the left or right in Audacity to respectively reduce or increase the gain of the track. They can also automate gain adjustments with the envelope tool, which enables Audacity users to adjust the momentary amplitude of a track. This involves selecting the envelope tool, which allows soundwriters to adjust levels for each of the relevant tracks and specify changes over time.
Technique 3. Panning Sounds
Soundwriters can also use panning to organize information, generate mimetic effects, and create additional headspace. Panning involves (re)positioning sounds and tracks between the left and right channels in stereophonic space. As Izhaki (2012) wrote, audio engineers often create panning schemes to imagine how various sounds should be positioned in the "stereo image"—a decision that can have a "profound effect on the mix" (p. 195).
Soundwriters can adjust panning to organize information. As Steven R. Hammer (2018) observed, traditional audio engineering in films typically places vocal tracks in the "center" channel, which splits the output so that it resonates from left and right speakers equally. This paradigm might also tend to place lower-priority information into the far left or right channels, therefore limiting the role of these sounds within both discursive and material ecologies. Panning may also serve a mimetic function, offering listeners the "sensation of movement" (Hammer, 2018).
In the video "Adjusting Channels," I point to the PMT to show the distribution of the overall mix volume across each of the two speakers, represented by horizontally stacked bars which are labelled with "L" and "R." Again, Audacity's GUI displays the PMT by default, which includes the default display of stereophonic channel space. Similarly, the stacked horizontal display draws users' attention (using the green-yellow-red color scheme) to the remaining capacity for each channel.
Adjusting Channels: Description/Transcript
[Video shows Mathew working the Audacity software to demonstrate how to pan tracks in Audacity. As he interacts with Audacity, he says the following.]
Mathew: We can go back to this Playback Meter Toolbar. [plays track]
One of the things that it shows us is there's quite a bit of information [stops track] happening in the left channel. So if there's stuff in the left channel that we can maybe shift to the right, that is something that could potentially offset some of the loudness that we're hearing. We can also—one of the big things right now is the volume of the sneeze. So let's move the sneeze over to the right track and see how that impacts the volume. So we've panned it 50% to the right, which means that most of the amplitude of this sound is going to be coming out of the right channel, and a much smaller portion is going to come out of the left channel. [plays track with panning adjustments]
So we can see that if we look at the Playback Meter Toolbar, it was a little more evenly split between the left and the right. There's still quite a bit of volume coming from this running track right now because that hasn't been adjusted yet.
Throughout most of the video "Adjusting Channels," a slightly greater proportion of the mix volume is distributed toward the left channel. While the audio clips in both channels, analyzing the PMT revealed a greater amount of headroom in the right audio channel. Therefore, one possibility for solving some of the clipping in the left channel is to move that sonic information into the right channel.
Technique 4. Observing Frequencies
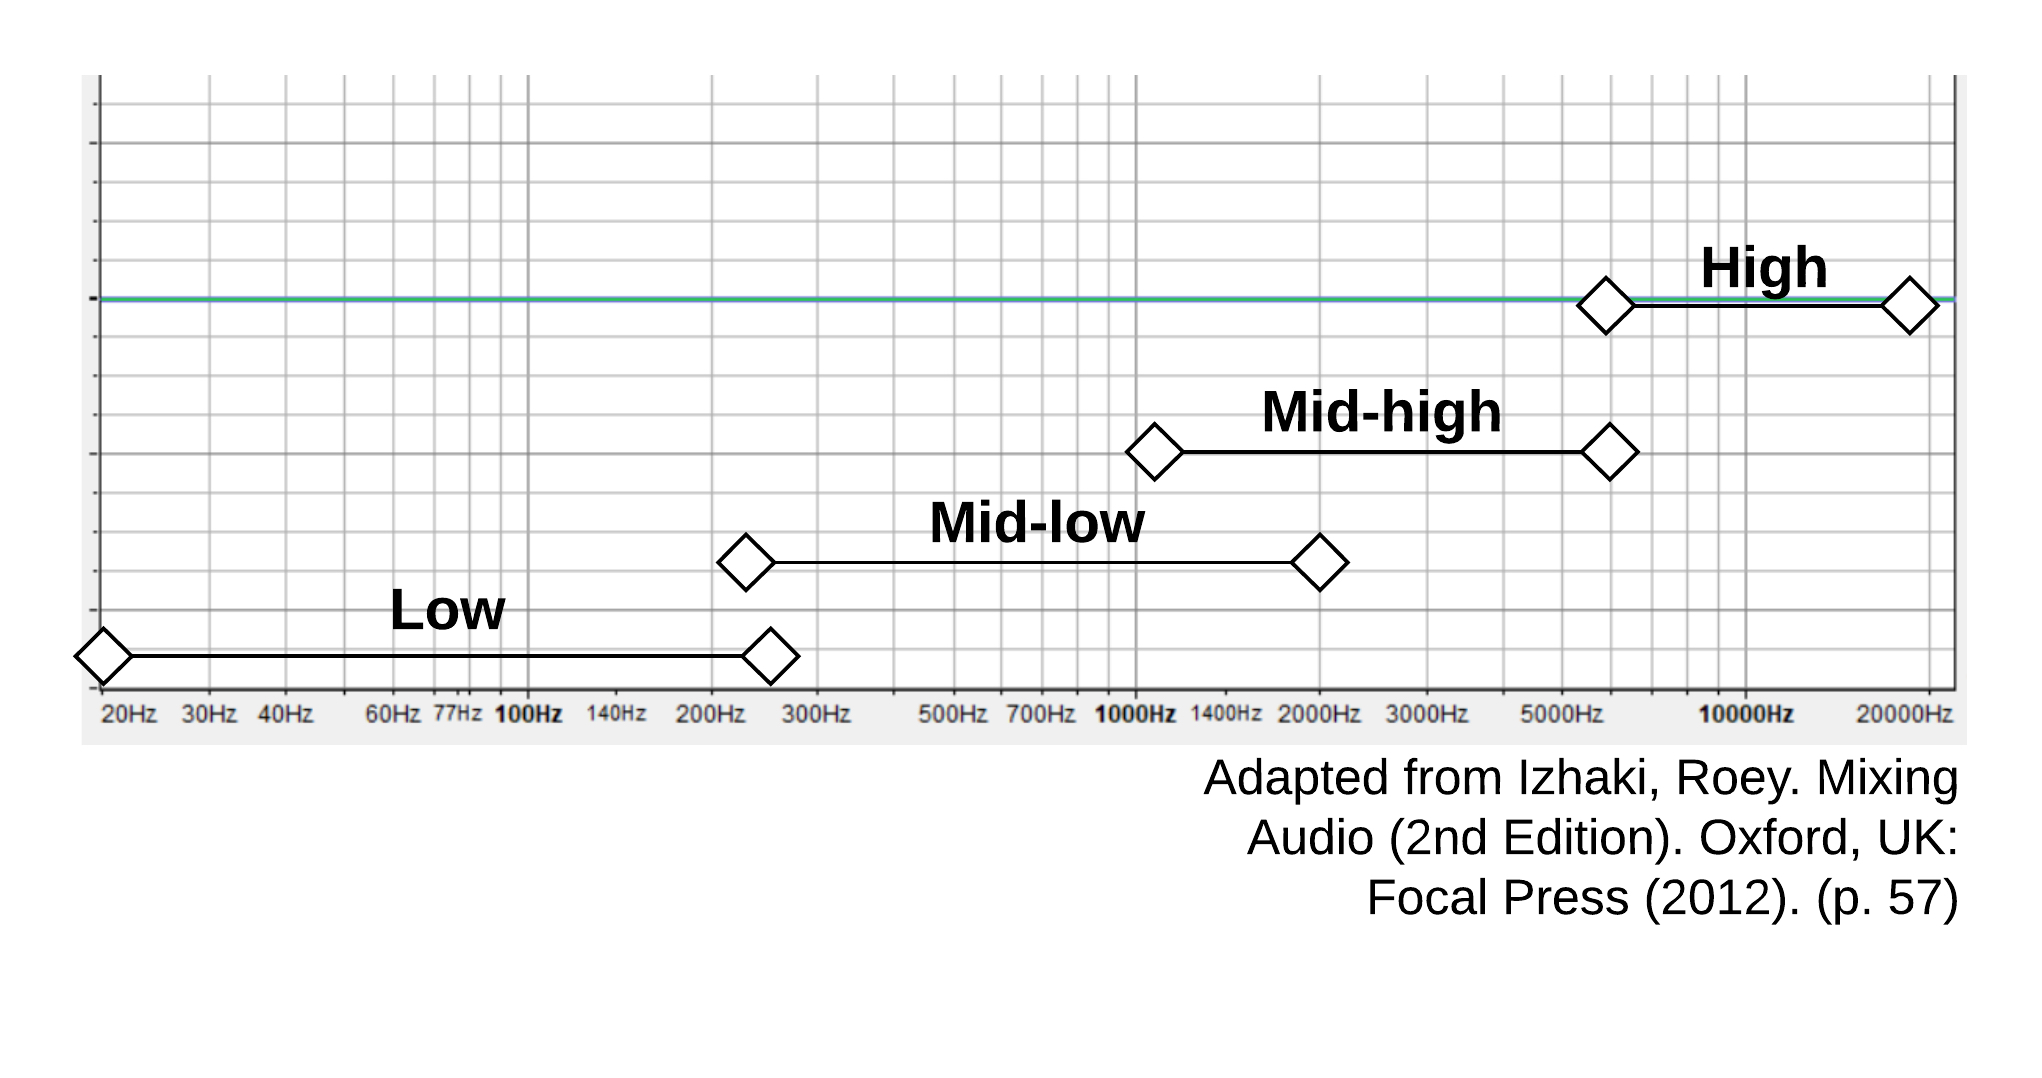
As Hammer (2018) has described, frequency refers to the pitches contained within a given sound. In simple terms, this refers to how "high" or "low" a sound is. Like channel space and amplitude, audio engineers treat frequency as an organizational vector, often identifying the four basic frequency bands: lows, low-mids, high-mids, and highs (Izhaki, 2012, p. 57–59; see Figure 3).
Figure 3. Low-, low-mid-, high-mid-, and high-range frequency bands. The low range of frequencies is between 20 and 100 Hz; low-mid range between 250 and 2000 Hz; high-mid range between 1000 and 6000 Hz; and high range between 6000 and 20000 Hz.
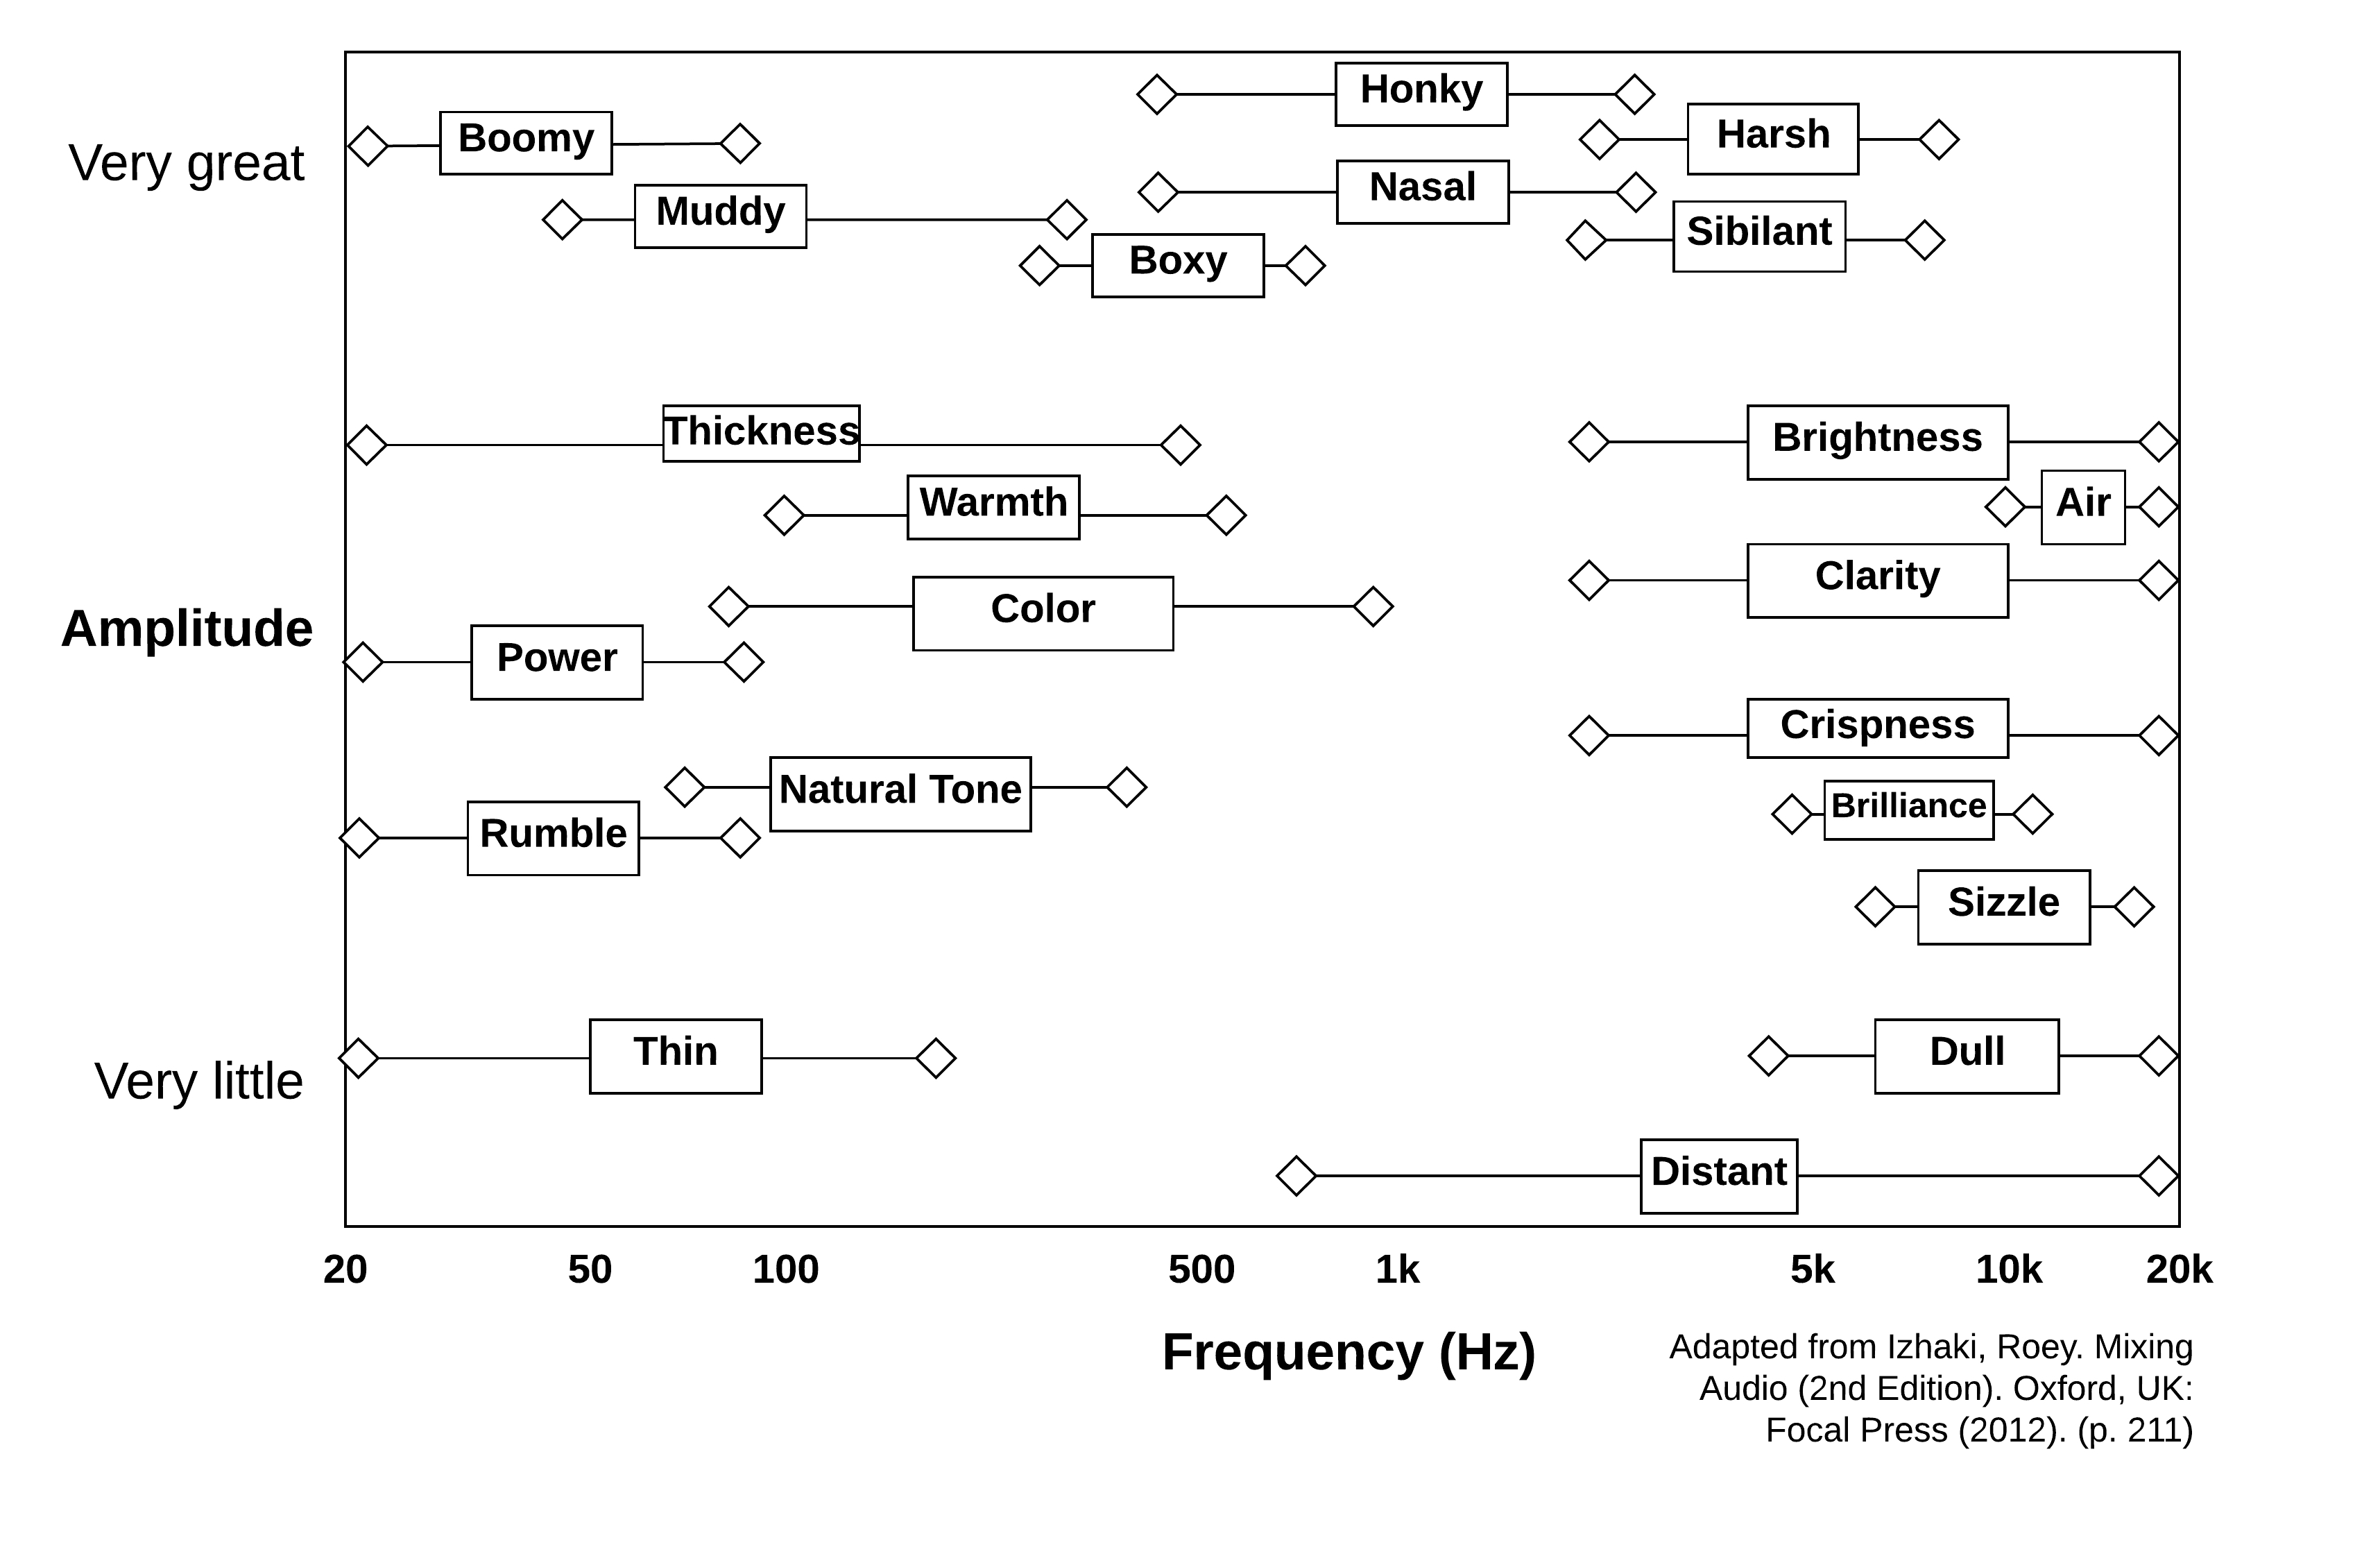
These frequency bands represent relatively distinct partitions in the spatial canvas of soundwriting. Moreover, these bands may have some distinct characteristics audio engineers associate with them. For example, Izhaki (2012) associated low-frequency content with "a darker, more mysterious mood" and high-frequency content with "happiness and liveliness" (p. 60). Adapted from Izhaki's descriptors, Figure 4 includes a detailed map of potential associations with maximum amplitudes in different frequency bands.
Figure 4. Descriptive terms Izhaki (2012) associates with maximum amplitudes of various frequency bands
Table 1. Descriptive Terms Izhaki (2012) Associates with Maximum Amplitudes of Various Frequency Bands
Term
Associated with
Frequency
Air
Moderate amplitudes of
high frequencies
Boomy
Very great amplitudes of
low frequencies
Boxy
Very great amplitudes of
low-mid frequencies
Brightness
Moderate amplitudes of
high frequencies
Brilliance
Moderate amplitudes of
high frequencies
Clarity
Moderate amplitudes of
high frequencies
Color
Moderate amplitudes of
low-mid frequencies
Crispness
Moderate amplitudes of
high frequencies
Distant
Very little amplitudes of
mid and high frequencies
Dull
Very little amplitudes of
high frequencies
Harsh
Very great amplitudes of
high frequencies
Honky
Very great amplitudes of
mid and high frequencies
Muddy
Very great amplitudes of
low and low-mid frequencies
Nasal
Very great amplitudes of
mid and high frequencies
Natural tone
Moderate amplitudes of
low-mid frequencies
Power
Moderate amplitudes of
low frequencies
Rumble
Moderate amplitudes of
low frequencies
Sibilant
Very great amplitudes of
high frequencies
Sizzle
Moderate amplitudes of
high frequencies
Thickness
Moderate amplitudes of
low and low-mid frequencies
Thin
Very little amplitudes of
low frequencies
Warmth
Moderate amplitudes of
low-mid frequencies
Soundwriters should pay attention to frequencies because compositions may become crowded when similar-frequency sounds mask others and because it can help aid the development of nondiscursive elements like "mood" or "character." When soundwriters use sounds composed of different frequency ranges, those sounds will be more distinct from one another and more audible, and the sounds will be less likely to "clip" than overlapping sounds in the same frequency ranges. However, when sound compositions are composed of sounds in similar frequency ranges, the audio output may begin to clip when even a relatively small range of frequencies exceeds 0 dB.
Observing frequencies also means paying attention to the amplitudes of sounds' various frequency ranges. In short, are soundwriters using sounds pitched in the high, high-mid, low-mid, or low ranges of the audible sound spectrum? Low-frequency sounds might include thunder or a bass drum, for example. Many people's speaking voices will contain frequencies primarily in the low-mid range, while sounds composed predominantly of high-range frequencies might include sibilant consonants or "hissing" noises (see Figure 4).
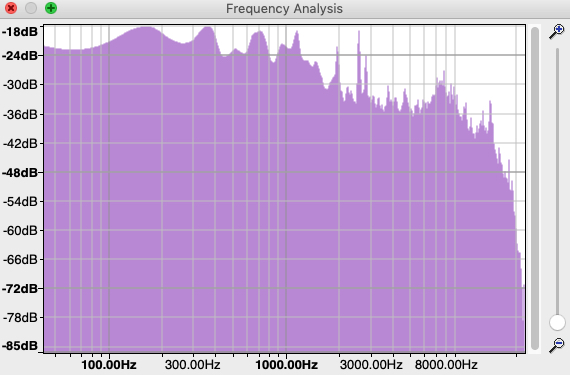
In Audacity and other DAWs, soundwriters can analyze the distribution of the amplitude of all frequencies using the "plot spectrum" function. This tool is under the "Analyze" tab at the top of the interface. Figure 5 shows the frequency analysis for the track "The Sneeze Problem" during the time between 00:10 and 00:40. As the analysis shows, there is still some available headroom in low and higher ranges. But in the low-mid range, especially between 250 and 1000 Hz, there are a few frequency bands with considerably less headroom. This suggests that one way to preserve headroom in "The Sneeze Problem" is to eliminate some of the audible mid-range frequencies.
Figure 5. Frequency analysis of "The Sneeze Problem." The analysis graphs the average amplitude of resonating frequencies across the range of frequencies between 20 and 10000 Hz. For "The Sneeze Problem," the analysis demonstrates an average amplitude of -27 dB for frequencies between 20 and 500 Hz, peak amplitudes approaching 0 dB for frequencies between 500 and 1000 Hz, and average amplitudes below -30 dB for frequencies between 1000 and 10000 Hz.
Technique 5. Apply Equalization (EQ) Functions
While soundwriters can plot the amplitudes of the various frequencies of sounds to rhetorically analyze the content of soundwriting, they can adjust audible frequencies by applying an equalization (EQ) function, sometimes called an EQ curve. An EQ curve is a form of signal processing that modifies "the relative amplitude of various frequencies within the audible bandwidth" for a given sound (Huber & Runstein, 2010, p. 61). The effect that this has is to boost, reduce, or suppress certain frequencies.
As with dynamics processing and panning, soundwriters can apply EQ functions to individual or groups of tracks for a variety of rhetorical purposes. In Modern Recording Techniques, David Huber and Robert Runstein (2010) mentioned several of these effects, stating that audio engineers sometimes use EQ functions to account for inadequacies or eccentricities of their original recordings (p. 439). For example, if an original recording of a bass player and drummer has too much presence from the high-end snare drum sounds, an engineer might use an EQ curve to suppress high-end frequencies to balance the recording or highlight the low end from the bass. Similarly, you might use the same EQ curve to try to eliminate a tape hiss on an original recording.
As the video "Applying an EQ Curve" demonstrates, soundwriters can apply an EQ curve to a sound or track by highlighting a portion of the track, navigating to the Effects tab, and selecting Equalization from the alphabetical list of effects. This will trigger a dialog box, which allows you to select EQ presets or create a unique EQ setting using either a "draw" or "graphic" mode. The "graphic" mode allows users to toggle the relative amplitudes of several preset frequencies. The "draw" mode is more precise, allowing users to boost or reduce specific frequencies. The video shows a "drawn" preset EQ, which I named "towercut," and which reduces the amplitude of all except the lower-end frequencies.
Applying an EQ Curve: Description/Transcript
[Video shows Mathew working in the Audacity software to demonstrate how to apply EQ functions in Audacity. As he interacts with Audacity, he says the following.]
Mathew: In order to create the sound that—or the impression that this sound is in another space, I applied an equalization function. That's located under the Effects tab. You'll see there's this function called "Equalization."
If we click that, what it will bring us is the audible sound spectrum, and it shows us at different frequency levels what should the amplitude be. This curve is called "treble boost"—there are some preprogrammed curves in Audacity. This one's called "treble boost," which boosts the treble sounds, or the high end of the frequency spectrum, or audible sound frequencies.
I've got another one called "towercut," which is particularly for this track. And we can see what this one does is eliminate a lot of the frequencies in the low-mid, high-mid, and high range. One of the things that this is going to do, if you look at the Izhaki handout that's in the chapter—or, sorry, the Izhaki visual that's in the chapter [Figure 4]—when we reduce the volume, the amplitude of these frequencies, it can create the sense of a sort of dull or distant kind of sound. So it'll create a sense of distance, or the impression that these sounds are being blocked as though there's a wall between the video games being played inside and the activity that's happening outside. [plays a quick excerpt with video game sounds heavily muffled]
You can see this is quite quiet now, so we're going to boost the gain even a little bit more. So now we've actually pretty much normalized it. That amplitude decrease really [chuckling] took a lot out of this track. [plays the same excerpt with the video game sounds a little louder]
And I'm going to go ahead and mute some of these other tracks as well so that we can hear this better.
[sound of computer mouse clicking]
Okay. And I've muted quite a few of the other tracks as well. [plays same excerpt with just video game sounds and phone call]
So now we can hear that those video game sounds, especially compared to [illustrates by playing quick clip of louder video game sounds], are both much softer and they sound much more muffled. And that's an effect of the equalization curve that we applied.
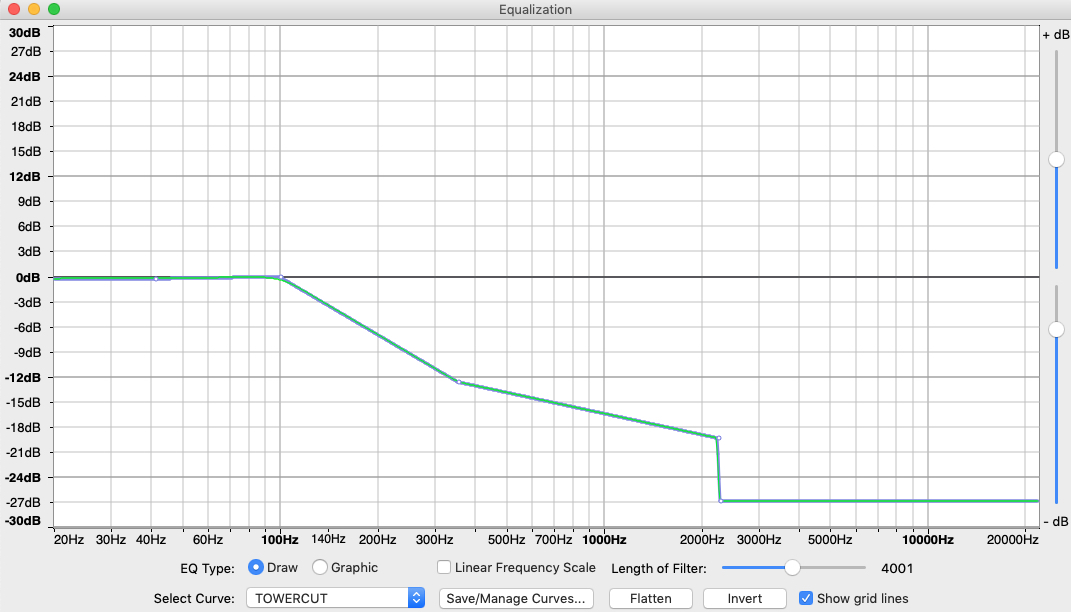
In "The Sneeze Problem," I applied an EQ curve that reduced the amplitude of mid-range frequencies in the video game noises, clock tower, and the sneeze. This has the effect of making the most significant sounds more audible and distinct and creates sonic description. These EQ curves help signal narrative shift (going from inside to outside, and into another room) because the EQ curve eliminates frequencies that are less audible when disrupted by spatial barriers, like a wall or a door.
Figure 6. Equalization (EQ) curve I used to reduce low-mid-, mid-high-, and high-frequency bands on "The Sneeze Problem." The EQ curve indicates sounds with frequencies between 20 and 100 Hz are not amplified. Sounds with frequencies between 100 and 350 Hz have decreased amplitude, with decreases ranging between -1 and -12 dB. Sounds with frequencies between 350 and 2200 Hz have decreased amplitudes, with decreases ranging between -12 and -20 dB. Sounds with frequencies between 2200 and 22000 Hz have decreased amplitudes, with a decrease of -27 dB.